 Grains –
I found it interesting on Friday to consider soybeans and meal and to a lesser extent wheat have all “corrected” a bit off their Feb highs and are hugging support levels near key moving averages (though admittedly they’ve both found some life overnight). Corn futures, however, remain relatively unscathed having bounced back following the ethanol “news” from last week and downticks since have been few and far between thus far. It got me thinking that there must be some demand element I’m missing to this puzzle, because looking at solid weather developments (so far) in Brazil and Argentina point towards excellent crop potential there and likely strong headwinds against US exports this summer/fall and beyond. So this morning let’s do a quick rundown of some key demand figures in corn.
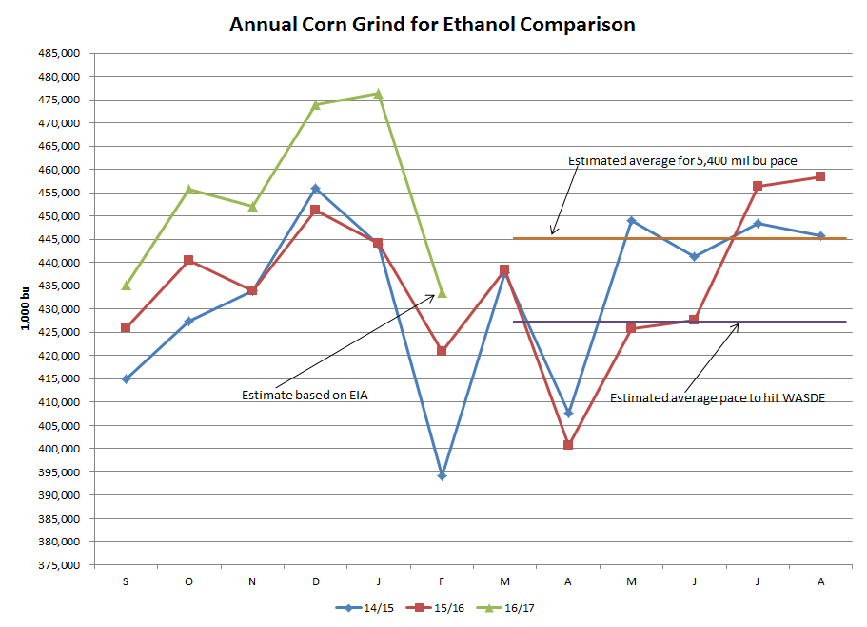
We’ll start with ethanol because that is obviously a major topic of conversation right now. Ethanol demand has obviously been very robust this year, aided largely by increased export demand. As you can see from the chart, this year’s ethanol production has followed basically the same pattern as we saw last year, but from a slightly higher base. Based on the expectation for a continued higher export base, it would stand to reason this similar pattern would continue going forward. Last year the Mar-Aug monthly corn grind averaged roughly 434 mil bu and to meet this year’s WASDE projection this year we need to average roughly 430 mil bu. That might argue that WASDE remains a bit too small on their projection, but probably not by a dramatic level. The orange line on the chart shows what we’d need to average to meet a 5,400 mil bu pace. Is a 50 mil bu difference a big deal to the corn balance sheet?
Please note this is just a small sampling of commentary available to clients. Please visit www.nesvick.com for more information.
DISCLAIMER:
The information contained herein has been taken from trade and statistical services and other sources we believe are reliable. Opinions expressed reflect judgments at this date and are subject to change without notice. These materials represent the opinions and viewpoints of the author and do not necessarily reflect the opinions or trading strategies of Nesvick Trading Group LLC and its subsidiaries. Nesvick Trading Group, LLC does not guarantee that such information is accurate or complete and it should not be relied upon as such. Officers, employees, and affiliates of Nesvick Trading Group, LLC may or may not, from time to time, have long or short positions in, and buy or sell, the securities and derivatives (for their own account or others), if any, referred to in this commentary. There is risk of loss in trading futures and options and it is not suitable for all investors. PAST RESULTS ARE NOT NECESSARILY INDICATIVE OF FUTURE RETURNS. Nesvick Trading Group LLC is not responsible for any redistribution of this material by third parties or any trading decision taken by persons not intended to view this material.