What is Volume Weighted Average Price?
Simple moving average calculations assign an equal weight to trade prices at constant time intervals. Volume Weighted Average Price (VWAP) is an average price calculation that assigns value to trade volume rather than trade time. For example, if 5 contracts trade at a price of 50 then one more trades at 56, the Volume Weighted Average Price is 51.
![]()
![]()
However, if the 5 contracts at a price of 50 traded during one minute and the 1 contract at a price of 56 traded during the next minute, the simple moving average would give equal weight to the two prices and result in an average price of 53. This exemplifies the major shortcoming of intraday moving averages, which is that they give equal weight to every time bar, regardless of volume traded. Is a test of a resistance level during thinly traded overnight hours as important as the same price movement right after a report is released? No. Volume Weighted Average Price avoids overvaluing low volume periods and undervaluing high volume periods to provide a more relevant average traded price.
Who uses VWAP?
Exchanges will often use Volume Weighted Average Price to determine settlement values. As of this writing, front month NYMEX Crude Oil (CL) “settles to the volume-weighted average price (VWAP) of all trades in the outright contract that are executed between 14:28:00 and 14:30:00 ET, the settlement period, rounded to the nearest tradable tick.” In other words, the Volume Weighted Average Price across a 2-minute span of trading determines the settlement price. Many other futures products follow a similar procedure over varying intervals.
In addition to exchange settlement procedures, some algorithmic traders use Volume Weighted Average Price as a component in black-box or grey-box systems. Think of VWAP as a volume profile study that’s compressed to one average price. Instead of a visual representation of how active different price levels are, VWAP provides a running numerical value of the average trade price. This can be used in conjunction with other studies and indicators to generate signals based on crossovers. For example, crossing up over the VWAP could signal the end of a bear trend. Standard deviation bands can be added that offer the possibility of mean reversion crossover signals.
Why would I use VWAP?
VWAP is useful for determining a more accurate average traded price. Moving averages often use closing price or typical price ([H+L+C]/3) in their calculations. This method ignores volume at price, which can be a significant factor in price action. VWAP is usually reset at the start of a new trading session. This allows a trader to remain aware of the day’s average trade price regardless of what chart timeframe he prefers. Since VWAP relies on trade volume, different bar sizes (i.e. 1-minute, 5-minute, or 15-minute) do not change the shape of the study. On the other hand, a 50-period moving average on a 15-minute chart will look very different compared to a 50-period moving average on a 5-minute chart. A better equivalent would be a 150-period moving average on the 5-minute chart to account for 3 times as many bars over the same time period. But at some point, an arbitrary decision needs to be made regarding moving average periods. VWAP does not require the same guesswork.
How can I use VWAP in T4?
T4 offers a pre-built VWAP study on most chart types. The Volume Weighted Average Price resets at the beginning of each trading session. Upper and lower standard deviation lines are applied to the chart as well. The standard deviation amount is configurable and can be removed if desired. For a link explaining how to add a study to a chart, please click here.
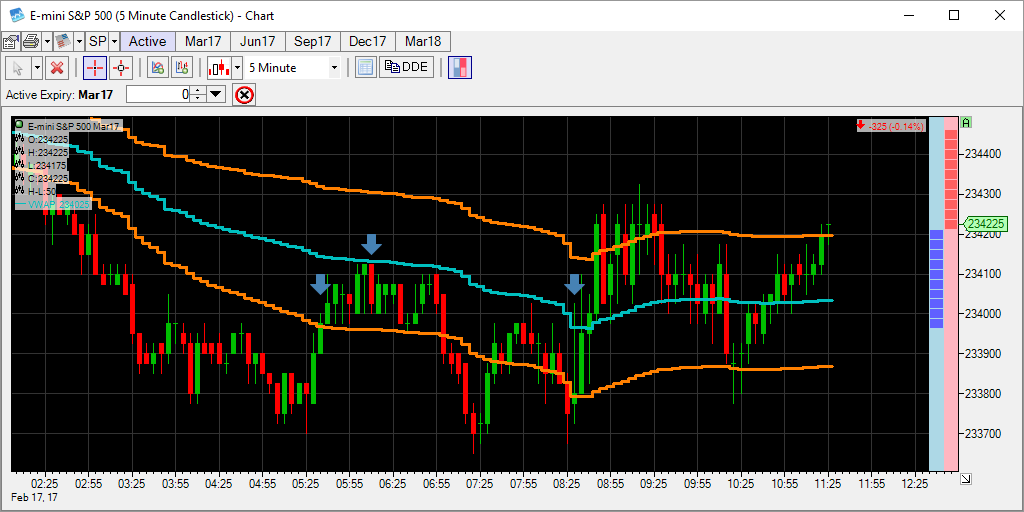
In the image below, the blue line represents the Volume Weighted Average Price of E-mini S&P 500 futures over today’s session. The orange lines represent 1 standard deviation from the VWAP. The futures had been in a down trend overnight before crossing up over the lower standard deviation during the 5:35 bar. Failure of the futures to cross over the VWAP can be interpreted to mean that the down trend is not over. Futures then continue back below the lower standard deviation before once again falling short of surpassing the VWAP. Finally at 8:30 the futures cross up over the VWAP and begin a short rally that exceeds the upper standard deviation.
Summary
Volume Weighted Average Price is a valuable tool when used in conjunction with other indicators. Its nature as a lagging indicator means it is not well suited to use as a stand-alone signal generator. Due to the fact that it generally resets at the start of each trading session it is best used for intraday trading.
If you have any questions or comments regarding this article please direct them to [email protected]